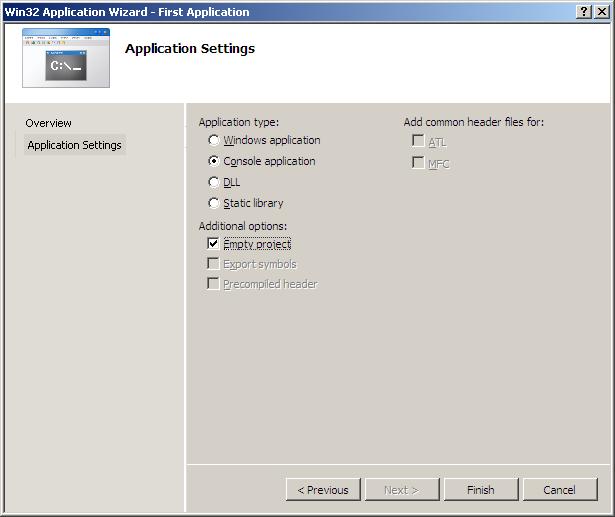
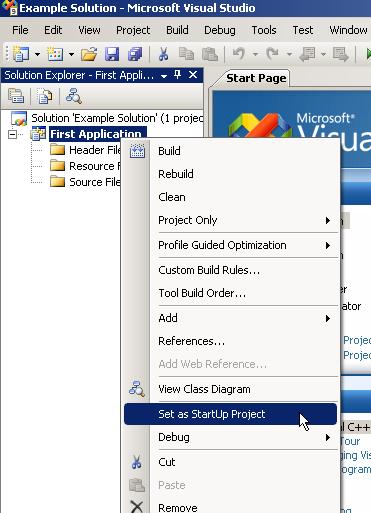
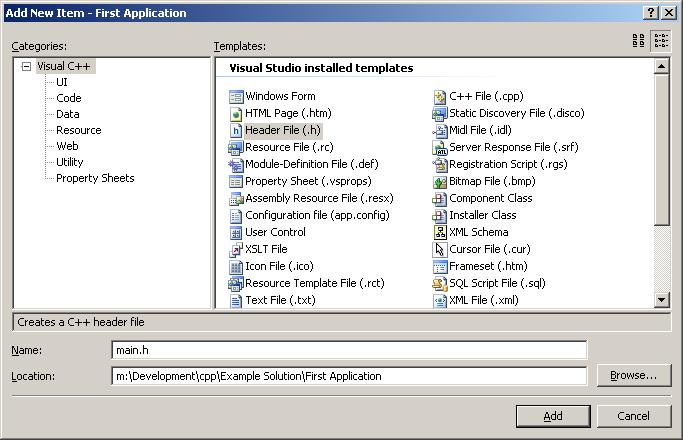
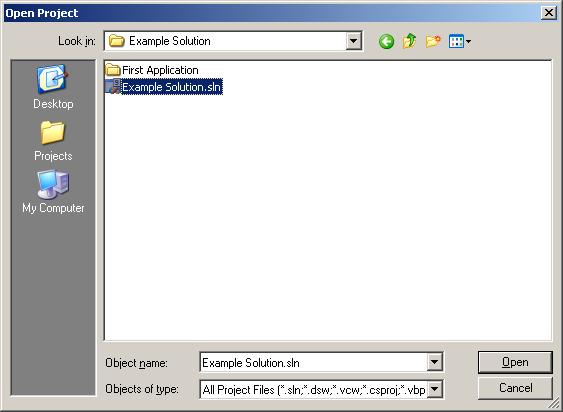
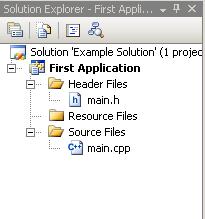
Software Design Using C++Using Microsoft Visual Studio 2008Starting the SoftwareMicrosoft Visual Studio 2008 is used as a common programming environment for Visual C++ and a number of other Microsoft development tools. If you have an icon for it on the desktop or on the Microsoft Office toolbar at the top of the desktop, just click on it to start it up. Otherwise you can probably find it under Start, Programs, Microsoft Visual Studio 2008, Microsoft Visual Studio 2008. When you start up Visual Studio you will probably be given a Start Page from which you can open previous projects if you wish to do so. Creating a New Solution (Workspace) and ProjectA "Solution" is used to group several projects together. (In Visual Studio 6.0 this was called a workspace instead of a solution.) Visual Studio 2008 differs from both Visual Studio 6.0 and .NET in that you do not create a workspace as a separate entity which Visual Studio loads before you create your projects in that workspace. Instead, upon creating the first project in a given solution, the base folder into which that project is created is considered the solution's base location. Select File, New, Project. You should see see a screen similar to this. Note that the contents of the "Project types" pane may differ from those pictured, depending on the configuration of your installation of Visual Studio. For each of your programming projects, you will create a new project and place them in the solution which we will create while creating this first project. By separating our source code into separate projects, we are able to collect related code into one location (when we have multiple files for a project) or at least keep our projects separate and thus more easily compilable. Many of our code examples will be done as text-based console applications. Therefore, select the outer-most category "Visual C++" in the "Project types" pane and then select Win32 Console Application as the template. Some of our examples will use the Dark GDK libraries for 2D/3D applications. For more information on creating a Dark GDK application, click here for the brief tutorial on the different steps necessary to create such an application. Next we must name both our project as well as the solution which will be created at the same time. At Saint Vincent College we recommend the use of your private M drive, specified as M:\. On your own PC you might want to use your C drive. Browse until you find the directory into which you will want your solution directory created. Enter the name "First Application" for the name of the project. Next, select the option "Create directory for solution" and enter "Example Solution" into the "Solution Name" field. When all of this is completed, your window should look like this. After clicking "OK," the "Application Wizard" dialogue will open. Click "Next" and on the next screen, deselect "Precompiled header" and then select "Empty project." Before clicking "Finish," your screen should look like this. Creating a New C++ Source FileIn your project you will want to have at least one C++ source file containing the code for your program. If you have more than one project in your solution, you need to be sure that the new one is the active project. The so-called Solution Explorer should be visible on your screen. (If not, use View, Solution Explorer.) Right click on the name of your project in the Solution Explorer. Then select Set as Startup Project to be sure that this is the active project, the one that you want to work on. Note that when Visual Studio 2008 creates a new project, it includes several filters which appear to be folders. These structures allow us to organize our code without altering the location of the files on the file system. When we have many different files which fulfill many different roles in our application, this is nice, particularly when files with different roles reside in the same directory. For now, we are only concerned with creating a new source file. In order to do this, right click on the "Source Files" filter, select Add->New Item. In this window, select the Visual C++ category in the left pane and then select "C++ File (.cpp)" in the right pane. Name the file "main.cpp" and create it in the root of the current project's directory. Before clicking "Add," the dialogue box should appear like this. Sometimes you will want to use more than one C++ source file. It is typical to place the main function in one source file, other stand-alone functions in another source file, and functions belonging to a user-defined class in their own source file. All of these files that belong to the same program must be added to the same project. Creating a New C++ Header FileA header file is a file with a .h extension. It is typically used to contain constants, types, class declarations, function prototypes, etc. Executable code is usually not placed in header files. To add a new header file to a project, one follows almost the same steps as in creating a C++ source file. Begin by checking that the correct project is active. Note that the Solution Explorer shows the name of the active project in bold. Next, right click on the "Header Files" filter in the Solution Explorer. Select Add -> New Item and then select the Header File template, using main.h as the name for the file. Click "Add" to add the file to the project. Compiling and Running a ProgramOnce you have created a project and its associated C++ source and header file(s), you are ready to compile. Actually, the best choice is often to "build" your project. For our example hw4 project, this would be done by selecting Build -> Build First Application. You do not want to use the Build Solution choice as it would compile every project that is in your solution, which would normally be a waste of time. Building will perform all of the final linking that is necessary to create an executable application. A project which compiles is not necessarily one which will build because of potential linking errors. For a project with multiple source files, the Build option is smart enough to only recompile files that must be recompiled due to changes made since the last time you compiled. Thus, Build (project name) is usually faster than Rebuild (project name) since the latter blindly recompiles everything in the currently active project. General messages from the compiler are placed in an Output window that can probably be found at the bottom of the screen. You can view any errors in the "Error List" tab in the output window. If either window is not shown at all, try selecting View -> Other Windows and then selecting the missing window. Of course, you can enlarge this window by placing the mouse on the dividing line between the window and the one above and dragging it. Note that double clicking on an error message conveniently takes you to the approximate spot in the program where the error occurred.To run your program, select Debug, Start Without Debugging. The program will run in a DOS window that shows all input and output. Saving Your WorkYou can find the save commands under the file menu. If you are editing a .cpp file, there should be a selection for saving it. If you first click on the project name in the Solution Explorer, the file menu will show a selection for saving the entire project. The safest option may well be Save All. Save often so that you do not lose much of your work should a computer lock up or the power fail. At Saint Vincent College we suggest that you save your files on your personal M drive. You might wish to copy your files to another drive in case the originals are somehow damaged. You can use My Computer to copy the desired files. (For example, use edit, copy and then edit, paste.) On a homework assignment it is important not to leave your .cpp and .h files behind on a public drive where others can see your work. Files saved on your M drive are pretty safe from the view of others. Returning to Your Solution, Project, and FilesBy way of example, suppose that your workspace is on your M drive. Start Visual Studio 2008. If the Start Window shows your desired solution, you can click on it. Otherwise, close the Start Window and select File -> Open -> Project / Solution. Browse to the directory of your solution and select the "*.sln" file in that directory. To select an existing project to work one, click on the project name within the Solution Explorer. Then select Set as Startup Project. You can, of course, create a new project if you wish to do that instead. (You start with File -> New -> Project. Remember?) If the file that you want to work on in the editor is not already visible, you can use File -> Open -> File to bring it into the editor. However, it is easier to use the Solution Explorer. If this window is not visible, try View, Solution Explorer. The Solution Explorer shows all of your projects by name. Look for your current project. It should be listed in bold to show that it is the current active project. If there is a little box with a + in front of the line for your project, click on it to expand what is inside of this project. Inside you will probably find three filters (which appear to be folders - see above for the explanation of filters), labeled Source Files, Header Files, and Resource Files. Your .cpp files will be in the Source Files folder. Your .h files will be in the Header Files folder. In most of these web pages we will not use the Resources Files folder. Expand the desired filter and then double click on the file that you want in order to bring it into the editor. To close a file that you no longer want on the screen, click x button at the top right of the editor window. You may have several files in the editor and want to close them all before opening another one. Debugging a ProgramThere are many ways to debug a program. One of the simplest is to use cout to output the values of key variables at various places in the
program. Another is to use the debugger. You can access it by selecting
Debug. This gives various choices, with the simplest being Step Into.
This will start the debugger at the beginning of your program and wait for you
to indicate what to do next. (It may take a few seconds for this to happen.)
The DOS box for input and output will probably automatically be minimized for you,
but if need be you can get it out of the way by minimizing it yourself (by clicking
on the _ button in its right corner).
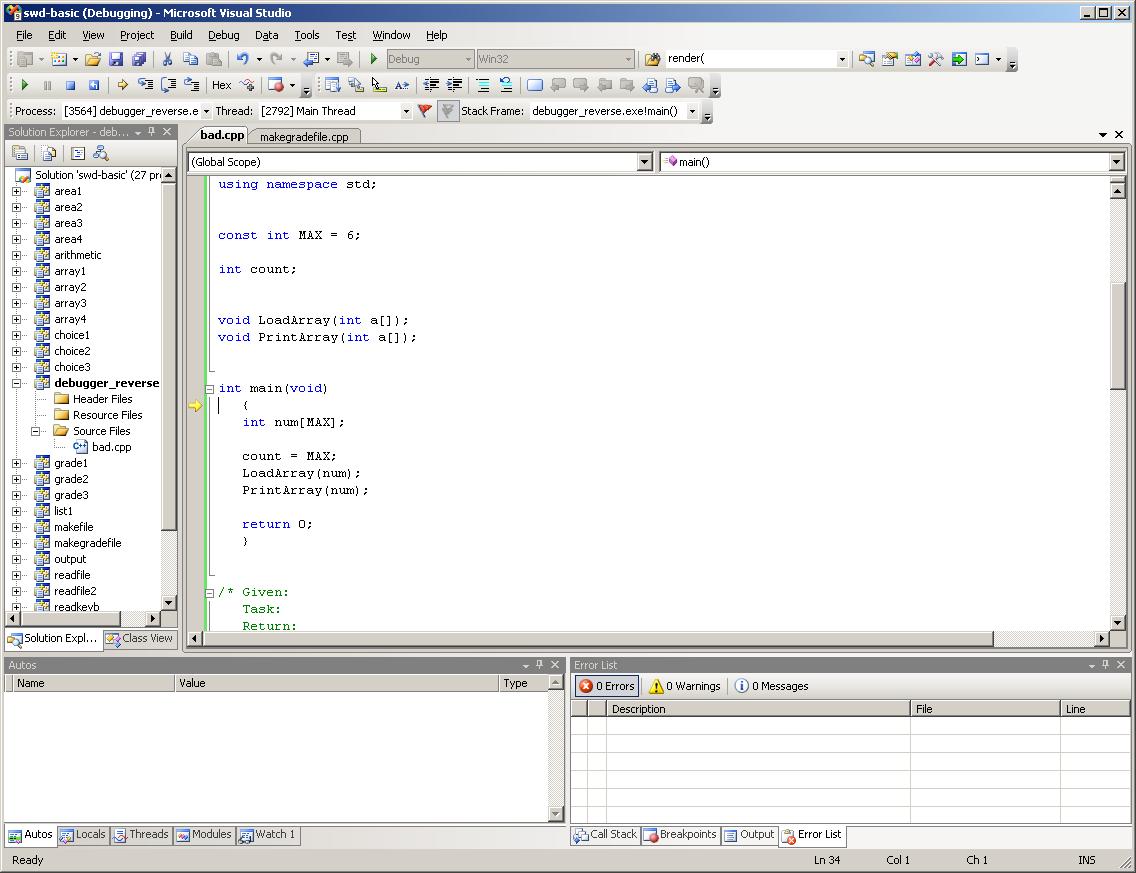
The Debug toolbar should now be visible. If for some reason the Debug toolbar cannot be seen, use Tools -> Customize -> Toolbars and see that the Debug toolbar is checked. Some of the most useful buttons on the Debug toolbar are a rightward blue arrow (to continue the program to the end), a blue square (to stop debugging), a backward arrow (to restart debugging from the beginning of the program), a Step Into button, a Step Over button, and a Step Out button. You can put the mouse over the top of a button to see the text description of the button. The Step Over button is used to execute one instruction and move the yellow location arrow to the next instruction. It is very useful for executing one instruction at a time. The Step Into button is similar, but will move you inside the code for any function call, where you could repeatedly use Step Over until you eventually get out of that function or you could use the Step Out button to get out of that function. The Continue button will run the program until the end or until a breakpoint is reached. You will read how to set breakpoints in an upcoming paragraph. When the debugger is running, one or more windows will typically be open for displaying values. Usually you use a window called Autos which automatically displays the values of variables currently in use. You may also use windows called Locals and Watch. With a Watch window you can click on a blank entry under the Name column and type in the name of a variable whose value you would like to watch. You can remove a variable from a Watch window by right clicking on it and selecting Delete Watch. These windows are very useful in seeing the current values of your variables as you move through your program using the Step Over (or similar) buttons. If the desired Autos, Locals, or Watch windows are not visible when you have the debugger running, you can turn them on by selecting Debug -> Windows -> and then the desired window.
If you want to look at the values in an array, you can put something like
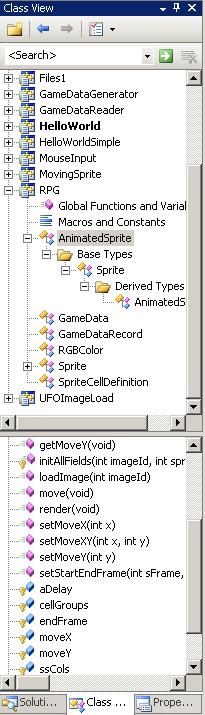
Note that to add or remove breakpoints (either before or after starting the debugger) you can right click at the desired location in the code and then click on Break Point -> (Insert Breakpoint or Delete Breakpoint), as desired. If you want to run your program to a specific point and then look at the values of the variables, set a breakpoint at this location and then use the Continue button to run to the breakpoint. (An alternate method is to right click on the desired location in the code and select Run to Cursor. You can also set Breakpoints by clicking on the gray margin to the left of the code text area.) The debugger has many more features which you can learn if you like. For example, you can set breakpoints that stop execution if some condition is true. You can view a simple representation of the stack used for function calls. And there is a lot more. See the Debugger Lab for a beginning practice exercise on using the debugger. Seeing Your Workspace Files and ClassesIn an earlier section the Solution Explorer, which lets you see a tree-like listing of your projects and their files, was explained. In a similar way, the Class View window lets you see any classes that you have set up in your project, along with their fields (variables) and methods (functions). Even if your program does not use classes, Class View can be helpful in that it shows you the names and parameter lists for all of your functions under Global Functions and Variables. As usual, if there is a box with a + in front of your project, click on the + to expand things to show the classes inside of your project. Then click on the + in front of a class name to see a list of the functions in that class. Double clicking on the class name will take you to the class declaration. Double clicking on a class function name will take you to the code for that function (its definition). You can also right click on a function, class, or variable to be given a context-sensitive menu that includes selections for going to these items in the code. Another useful thing that you can do in Class View is to right click on a class name and then select Add. You are then given a choice of adding a function (method) or variable (field) to this class. You can also right click on your project name in Class View, select Add, and use this to add a new class to your project. We will not go into the details of these two items here, but you might want to try them on your own. Customizing a ProjectIn the Solution Explorer you can right click on a project, select properties, and then see all of the properties for this project. This includes compiler and linker options that are in use for your project. Although you can change these settings, do so at your own risk. The default settings will almost always be appropriate. By default, Visual C++ uses a Debug configuration when compiling your project. Once you have your project working well, you may wish to switch to a Release configuration. This will typically produce a faster and smaller executable. It does this in part by leaving out information needed to use the debugger. Thus a Release configuration is only used when you are done with debugging. To change the configuration between Debug and Release use Build -> Configuration Manager and then click on the little triangle pull down for the box labeled Active Solution Configuration. This will let you select the Debug or Release configuration. (There is also a grid of information for all of your projects. Here you can change the desired configuration for any of these projects.) PrintingIf you have a file in the editor, use File, Print to print it. Check that the pull-down has the desired printer selected. Then click on OK. Finding Some TextIf you need to find some particular text (perhaps a variable name) within the file shown in your editor window, use Edit -> Find and Replace -> Quick Find. Each time that you click on Find Next it will go to the next line of code in the editor that has the desired text in it. If you want to look within all files in your project, use Edit -> Find and Replace -> Find in Files. It will show all of the matches it found in a Find Results window. You can click on any line of the results to go to that line of code in the editor. Adding Files to a ProjectIf you already have some .cpp and/or .h files that you would like to add to an existing project, first use My Computer to copy these files into the project folder. Then click on your project in the Solution Explorer. Select Add -> Add Existing Item. You are then given a dialog box where you can select the desired file(s). Note that inside your project folder you will see a subfolder named Debug and perhaps a subfolder named Release. Inside the Debug folder is where the executable file (such as First Application.exe) is located. If you created a release version of your program, its compiled executable is inside the Release folder. This is the file that you would distribute if you were making your program available for others to use. HelpExplore the items under the help menu to see what is available. The most commonly used item is Search. Once you select this, put the name of the item that you wish to search for in the Look for: box. Use the pull down triangle in the second box (labeled Filtered by:) to limit the scope of the search to something reasonable such as "Visual C++" or perhaps "Visual Studio". Otherwise you may get so many matches as a result of your search that you won't be able to wade through them all. Related Items |
Computing & Information Systems |
|

 Search CIS Site
Tutorials
Search CIS Site
Tutorials
|