Optimization Problems:
Here we try to locate the maximum and minimum of a function on a certain closed interval.
Remember that when our text says maximum or minimum they mean absolute maximum and
absolute minimum, not relative maximum or relative minimum.
First Example:
In[16]:=
![]()
Out[16]=
![]()
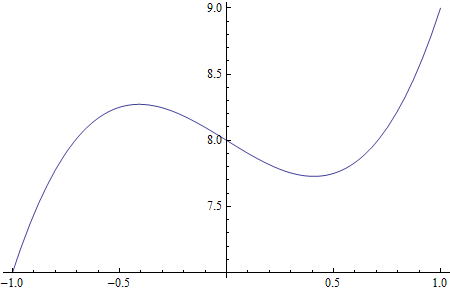
Let's find the (absolute) maximum and minimum for this function over the interval [-1, 1].
A graph would help us to see what we are working with. Note that the numbers on the y axis
start at 7; don't be deceived into thinking we have a zero of the function at -1.
In[17]:=
![]()
Out[17]=

Our usual method to find maximum and minimum points is to find where the y-values at the x -values
where the derivative is 0 and to look at the value of the function at each endpoint of the interval.
We start by making sure that we can find the derivative:
In[18]:=
![]()
Out[18]=
![]()
To find where the derivative is 0 you can try Solve or NSolve (which gets a numerical approximation
to each solution). Since we probably want numerical answers (as the exact ones may contain messy
fractions and the like), let's use NSolve:
In[19]:=
![]()
Out[19]=
![]()
We need to know the function's values at these x-values. One method is to use /. to evaluate the
function. If we follow that by %, the function will be evaluated at the 2 numbers just given as answers.
In[20]:=
![]()
Out[20]=
![]()
The x values we have just found are candidates for where the max and min occur (and the f[x] values
are the y-values that correspond to them), but we are not done. There are other condidates to examine.
We need to know the function values at the endpoints. Both can be done at once as follows. Remember
that you can find the arrow symbol on the BasicMathInput palette (found under the Palettes menu).
In[21]:=
![]()
Out[21]=
![]()
Finally, we analyze what we got above and decide what the max and min points are (if they exist at all).
To do this, it might help to paste into one place the numbers we have found for possible max/min points:
(-0.408248, 8.27217)
(0.408248, 7.72783)
(-1, 7)
(1, 9)
We look through these 4 points and easily see that 9 is the largest y-value.
Answer: The maximum function value is 9 and occurs at x = 1.
Similarly, we see that the 7 is the smallest y-value in the list of 4 points.
Answer: The minimum value is 7 and occurs at x = -1.
Your should look back at the graph of the function to see that these points really do seem to be the
absolute max and min points. If not, recheck both the graph and your calculations. In our graph
the endpoints clearly give the absolute max and min, so we are good.
It was not part of the problem, but you can note that we also have a local maximum of about 8.27
at x = -0.408 and a local minimum of about 7.73 at x = 0.408.
Second Example:
Find the max and min points for the following rational function on the interval [-2 , 3]:
Step 1: Define the function.
In[22]:=
![]()
Out[22]=
![]()
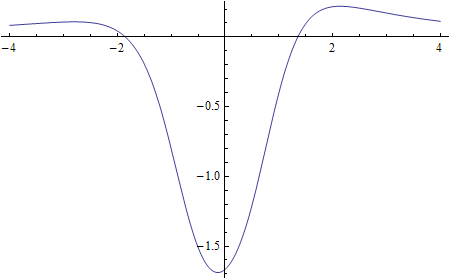
Step 2: Graph the function. Be sure to cover at least the interval [-2, 3] given in the problem.
In[23]:=
![]()
Out[23]=

Step 3: Try the derivative.
Be sure that Mathematic can find the derivative of this function before proceeding:
In[24]:=
![]()
Out[24]=
![]()
Step 4: Find where the derivative is zero.
In[25]:=
![]()
Out[25]=
![]()
The third and fourth solutions are not of interest since they are complex numbers. That is,
they contain the imaginary unit i. Only the first two and the last are real numbers.
Step 5: Find the function values (y-values) at these points:
In[26]:=
![]()
Out[26]=
![]()
Step 6: Find the values of the function at the endpoints of the interval:
In[27]:=
![]()
Out[27]=
![]()
Change to numerical form so that we can compare the various y-values.
In[28]:=
![]()
Out[28]=
![]()
In[29]:=
![]()
Out[29]=
![]()
In[30]:=
![]()
Out[30]=
![]()
Step 7: Anaylze the numbers and give the answers.
The possible max/min points are:
(-2.80311, 0.108982)
(2.13615, 0.220622)
(-0.133363, -1.68907)
(-2, 0.0434783)
(3, 0.172043)
The result is that the maximum is 0.220622 and occurs at about x = 2.13615,
while the minimum is about -1.68907 and occurs at x = -0.133363.
These answers seem to fit well with the graph of our function, so we are fairly
confident that we have the correct answers.
| Created by Wolfram Mathematica 6.0 (09 January 2008) |