Graphing with Mathematica
Example 1: This is a mathematical model for a voting situation. If x is the proportion of the popular vote going to the Democratic presidential candidate, then the proportion of the seats in the House going to Democratic candidates is approximately given by the following function.
Note how we define a function, with the square brackets and the underscore.
![]()
![]()
Always check that what Mathematica outputs for your function definition matches what you intended your function definition to be.
Here is how you graph a function. Note how you specify the range of x values used in the graph.
![]()
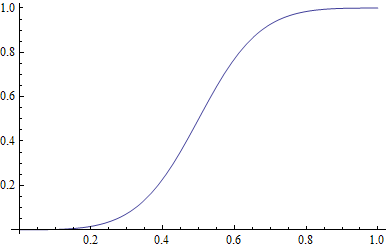
Interesting questions, while looking at this function: What does it mean that f(0.5) = 0.5? What does the curvature tell us?
Partial answers: If the proportion of the vote x going to the Democratic presidential candidate is greater than 0.5, then the proportion of the seats in the House going to Democrats is even greater than x. Similarly, if x is smaller than 0.5, then the proportion of the seats going to Republicans gets amplified.
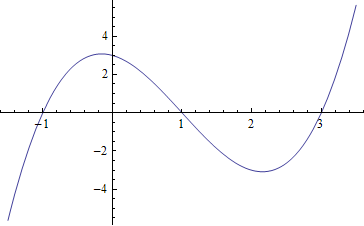
Example 2: Graph the following function.
![]()
![]()
![]()
Example 3: A similar polynomial function is the following.
![]()
![]()
![]()
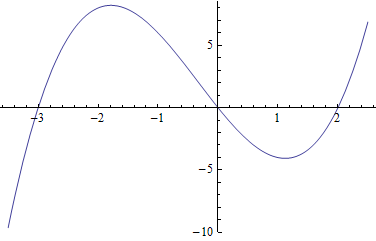
If you want to find the x-intercepts (the zeros of the function), you can solve to see where the function value is zero:
![]()
![]()
These numbers match with where the x-intercepts seem to be in the graph, so we are pretty sure that we have the right answers.
Example 4: Suppose that the number of bacteria infecting a person after time t (when t = 0 is the moment of initial infection
and time is measured in hours) is given approximately by the following function. Suppose also that the number of bacteria
is given in millions.
![]()
![]()
Graph and find the approximate maximum.
![]()
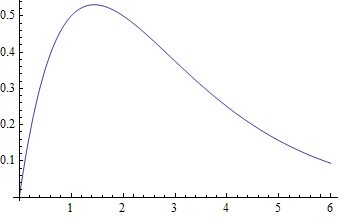
The max value is about .51, representing 510,000 bacteria, at about time t = 1.4 hours.
Elsewhere we look in detail at how to find maximum and minimum points with Mathematica.
Example 5: Let's graph a higher-degree polynomial than above. Also find the zeros.
![]()
![]()
![]()
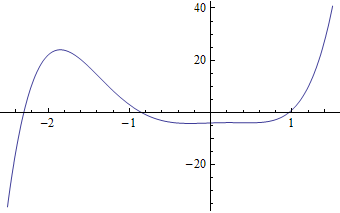
We can estimate where the x-intercepts are from the graph. However, let's use NSolve to find more accurate answers:
![]()
![]()
Note that the third and fourth numbers in the output are complex numbers. Since these 2 are not real numbers, they cannot give x-intercepts (as x-intercepts are on the real number line). Thus we found three x-intercepts. They seem to fit reasonably with the three spots where the above graph intersects the x-axis.
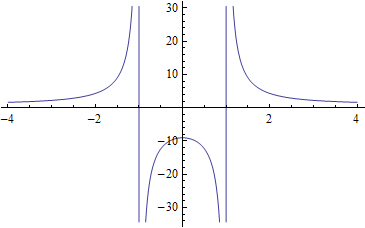
Example 6: Let's graph a rational function:
![]()
![]()
Note carefully how we used parentheses in order to get the desired function. If you leave them out you get a vastly different function:
![]()
![]()
That is not the function we want, so we will ignore function w and use function t.
![]()
| Created by Wolfram Mathematica 6.0 (09 January 2008) |